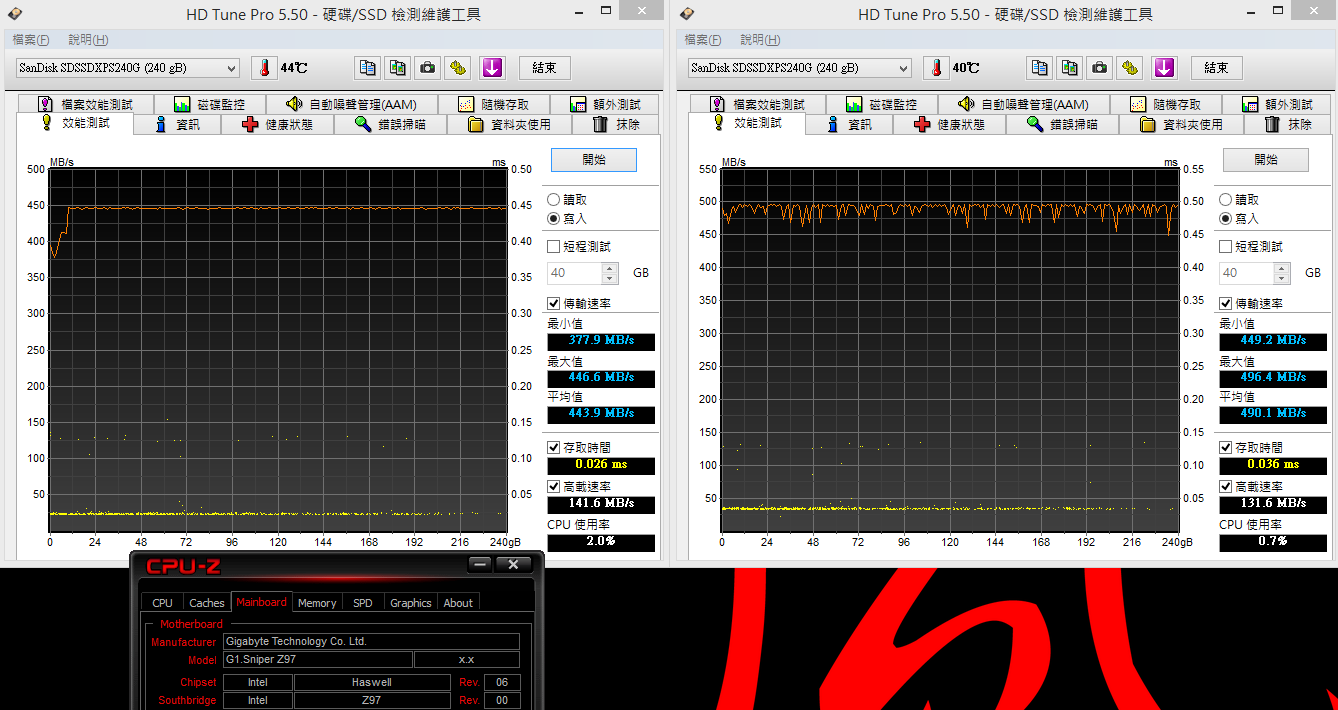
64K - Write - Average 443.9 MB/s Access Time 0.026ms
8MB - Write - Average 490.1 MB/s Access Time 0.036ms
64K - Write - Average 429.7 MB/s Access Time 0.027ms
8MB - Write - Average 486.9 MB/s Access Time 0.038ms

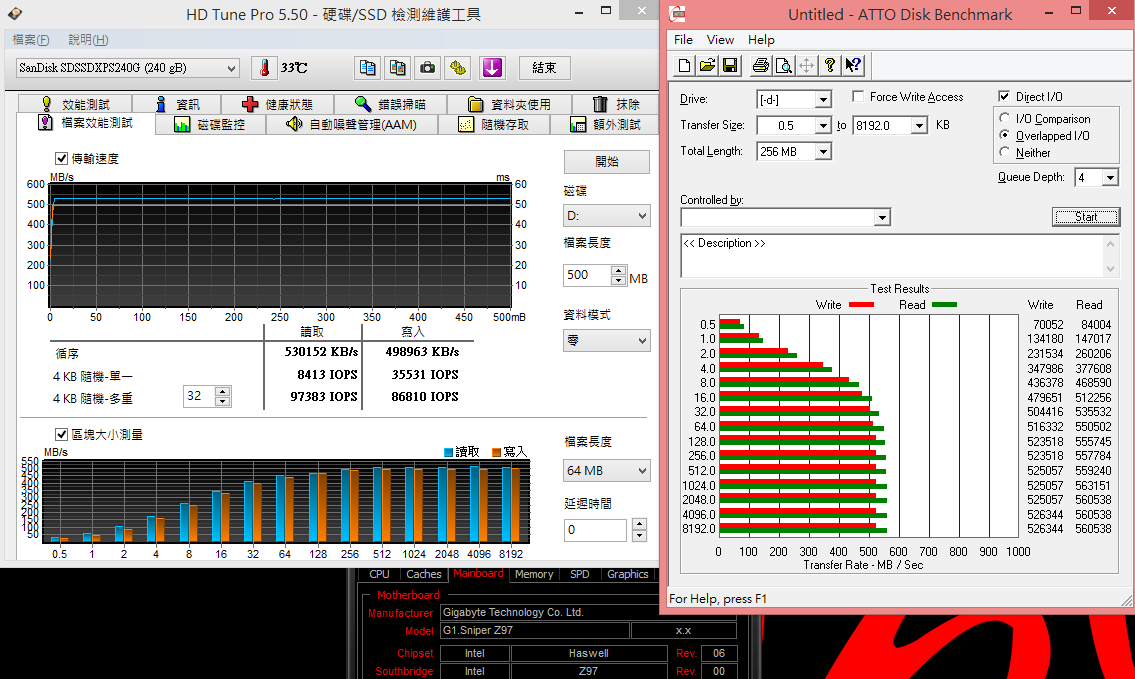
SanDisk Extreme PRO在HD Tune Pro Write項目中表現出色
搜索時間落在0.026~0.038ms,重點在於寫入曲線的起速超過400 MB/s以上
測試過有些高階SSD在64K - Write會有大起大落的傳輸速度,或平均速度不到200 MB/s
SanDisk Extreme PRO在同樣的測試項目下有接近430 MB/s的高水準
File Benchmark
Sequential 4KB randon Read - 97383 IOPS / Write - 86810 IOPS
ATTO DISK Benchmark超過128KB以上開始接近最高讀取560.5 Mb/s,寫入526.3 MB/s
Sequential 4KB randon Read - 97403 IOPS / Write - 85818 IOPS
ATTO DISK Benchmark超過64KB以上開始接近最高讀取523.7 Mb/s,寫入526.3 MB/s

ATTO DISK Benchmark在64K以上已經讓讀取與寫入都有500 MB/s以上的效能
而在0.5~2K檔案傳輸效能更是出色,勝過已測試過的Intel 730 Series 480GB許多
CrystalDiskMark
Seq Read - 547.8 MB/s Write - 514.3 MB/s
<All 0xFF, 0Fill> Read - 550.9 MB/s Write - 516.8 MB/s
<All 0x00, 1Fill> Read - 548.0 MB/s Write - 514.3 MB/s

Seq Read - 548.3 MB/s Write - 515.4 MB/s
<All 0xFF, 0Fill> Read - 548.0 MB/s Write - 514.9MB/s
<All 0x00, 1Fill> Read - 548.8 MB/s Write - 515.2 MB/s

CrystalDiskMark預設測試為隨機測試與兩種純粹循序模式都有一樣的速度表現
這部份是Marvell Controller的優勢之一,Seq傳輸數據與官方規格相當接近
4K QD32 Write與Read的兩個項目也是目前SATA3 SSD數一數二高的水準
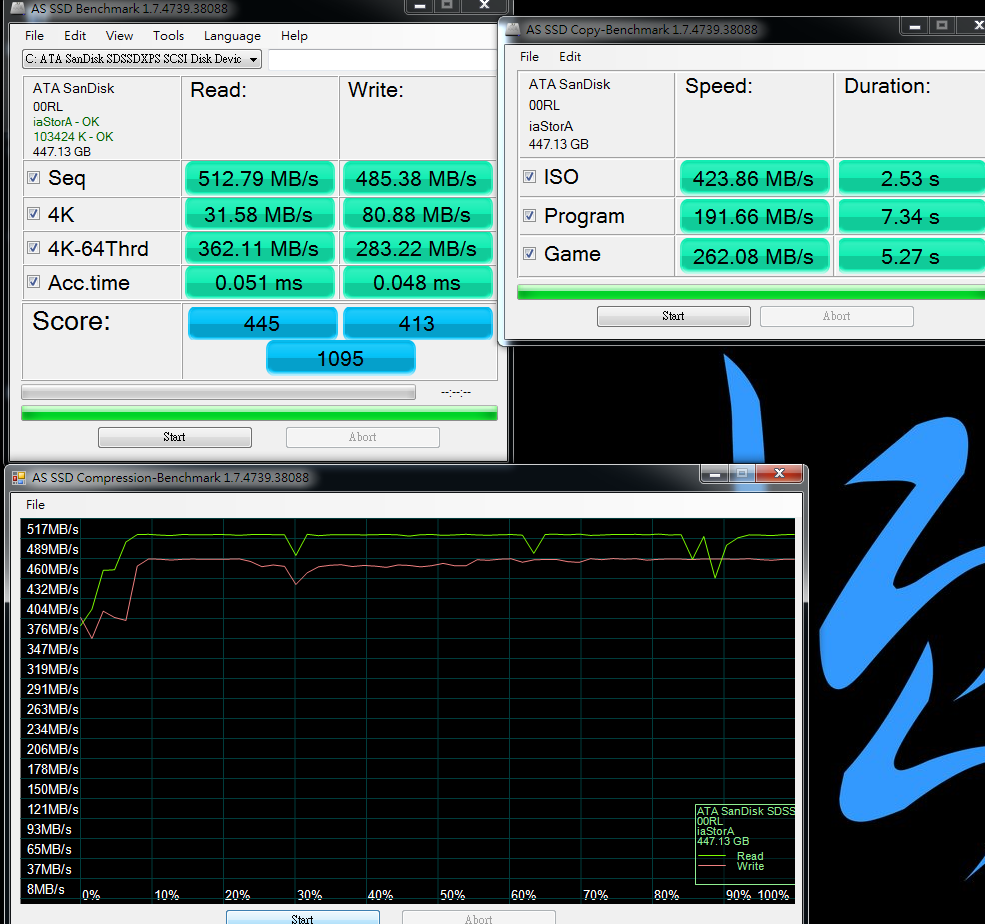
AS SSD Benchmark - 1118
Seq Read - 526.51 MB/s Write - 494.30 MB/s
4K - 64Thrd Read - 357.62 MB/s Write - 247.29 MB/s

AS SSD Benchmark - 1175
Seq Read - 525.94 MB/s Write - 492.08 MB/s
4K - 64Thrd Read - 367.33 MB/s Write - 292.44 MB/s
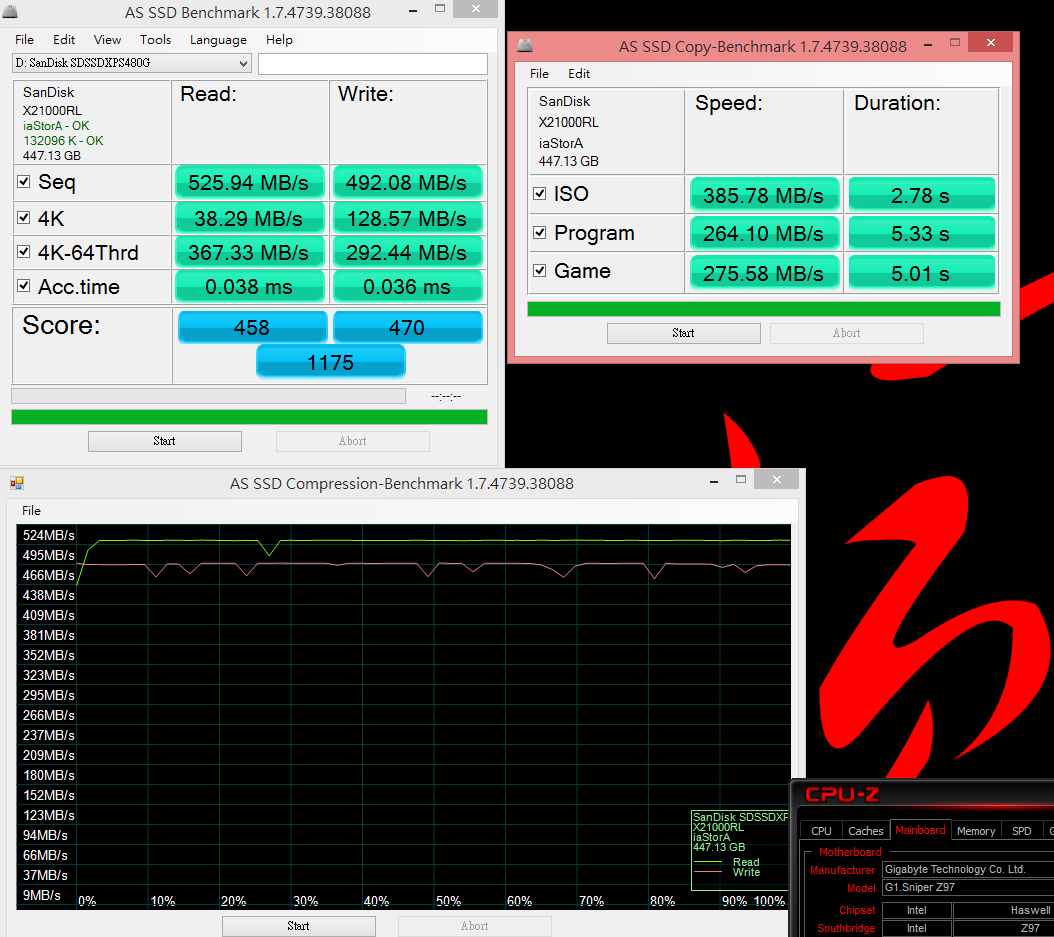
現今頂級SATA3 SSD在AS SSD Benchmark中可以拿到1100以上的分數
4K-64Thrd Read可達到357~367MB/s,可以視為新一代SSD性能指標之一
Compression Benchmark數據也呈現近似一直線的傳輸數據
Seq Read約在525MB/s以上,Seq Write也約有494MB/s
PCMark Vantage - HDD Score : 78950
SSD Benchmark TOTAL => 5127.39

PCMark Vantage - HDD Score : 78162
SSD Benchmark TOTAL => 5093.71

比較可惜的是PCMark Vantage HDD測試項目並沒有達到官方標示的81000分
效能落差約2.6~3.5%,還算在可接受範圍之內,也先將G1.Sniper Z97更新至F6 BIOS
F6版本標示可改善SSD效能,以往測過GIGABYTE MB在SSD某些數據上會偏低一點
這部份可能為MB調效問題,也希望GIGABYTE可以再強化BIOS,讓SSD能有更完整的性能發揮 |


 發表於 2014-8-7 09:10 PM
|
發表於 2014-8-7 09:10 PM
|